If you’ve spent any time in the investing world lately, you’ve probably seen Marc Chaikin’s face in an ad predicting the next market shake-up. He’s the man behind the Power Gauge Report — a service that promises to help you find winning stocks before Wall Street catches on.
According to his company, Chaikin Analytics, the service runs on a proprietary system that crunches a mix of fundamentals, technicals, and sentiment data to rate thousands of stocks.
On paper, it looks impressive… but is it really a breakthrough for everyday investors, or just another case of clever marketing dressed up as data science?
I decided to find out. I joined the Power Gauge Report to look inside the members’ area, analyze Marc Chaikin’s stock picks, and see how the service has performed in 2025.
In this review, I’ll show you exactly what I found.
I’ll also share the service I personally rate higher: a no-hype service run by a market veteran with a history of spotting life-changing stocks, long before Wall Street’s algorithms do.
See My Top-Rated NewsletterWhat I Found After Joining the Power Gauge Report
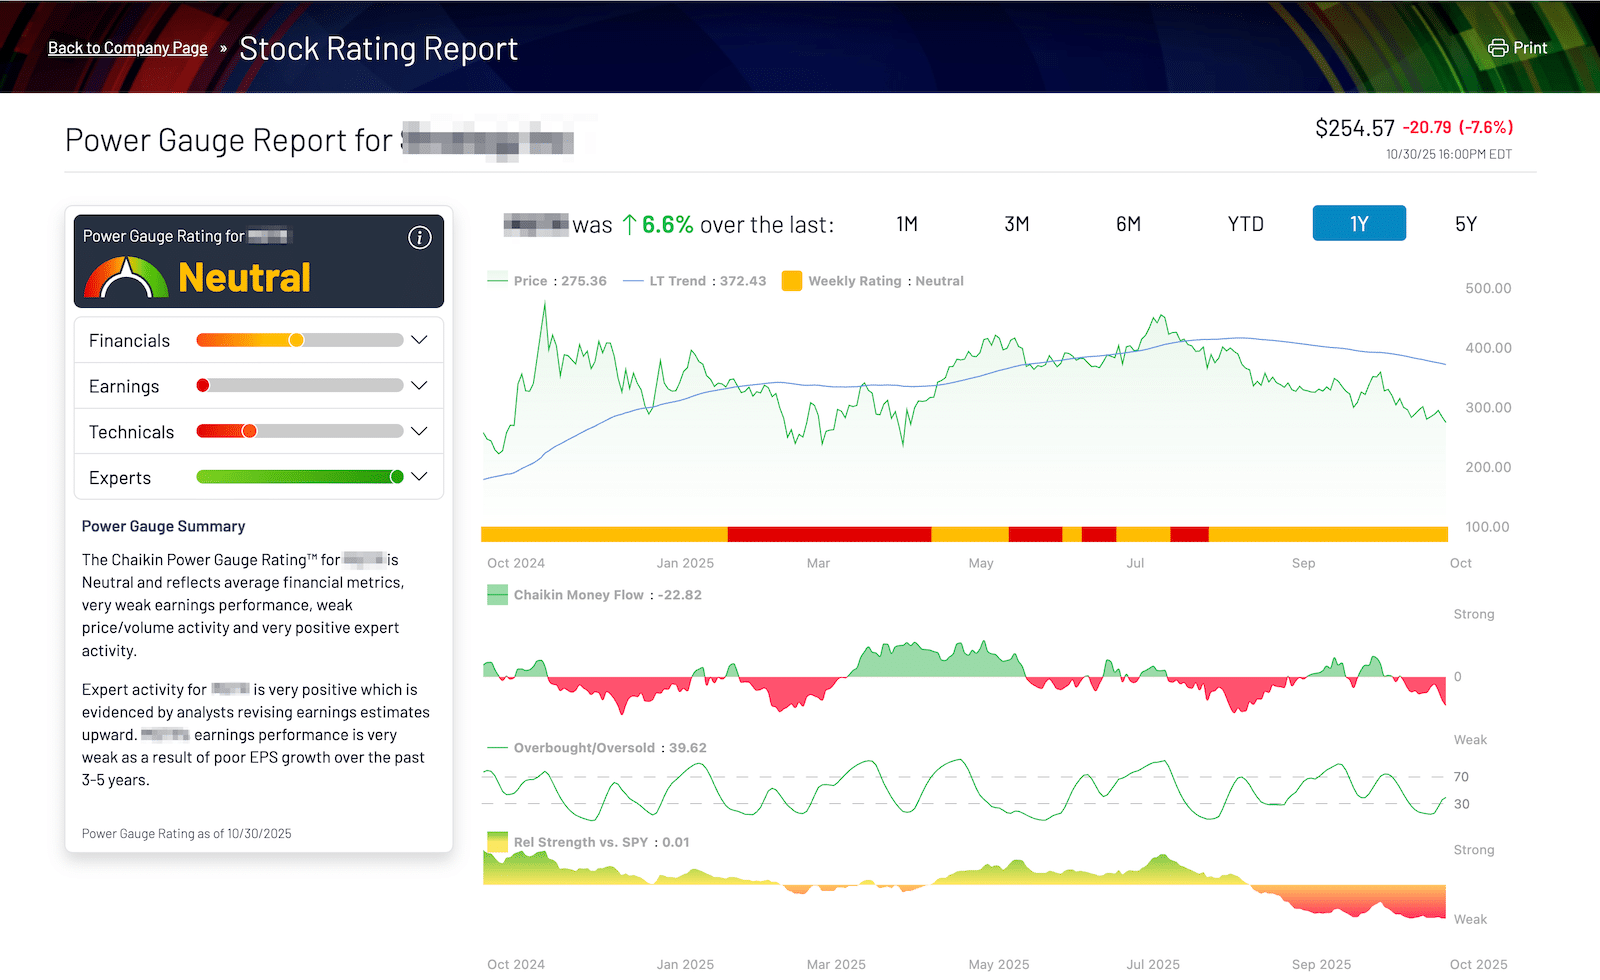
The Power Gauge Report is Chaikin Analytics’ flagship stock-picking newsletter, priced at $499 per year. It’s built around Marc Chaikin’s proprietary Power Gauge system — a 20-factor model that rates thousands of U.S. stocks as bullish, neutral, or bearish.
The system combines both fundamental and technical data. It looks at things like earnings growth, profit margins, analyst sentiment, price momentum, and insider activity — then distills all of it into a simple overall score.
The idea is to give investors a quick, data-driven view of where a stock might be headed. You can enter any ticker into the system and instantly see its rating and breakdown.

Marc Chaikin uses this system to find mid- or large-cap stocks to recommend to Power Gauge Report subscribers. And he claims these picks could make you “three to five times your money,” which is ambitious, to say the least.
Each month, you get a new newsletter highlighting his #1 stock, based on the Power Gauge rating system, which he does a full write-up about. You also get instructions on when and how to buy, along with updates when he recommends selling a position.
The members’ area is clean and easy to navigate, and the combination of tools, research updates, and stock recommendations gives it more substance than most investing newsletters.
Does that mean Marc Chaikin’s stock picks will make you money?
Not necessarily.
As I discovered after joining, there is no such thing as a perfect stock rating tool.
How Have Marc Chaikin’s Power Gauge Stock Picks Performed?
Performance is where any stock-picking service either proves itself or falls apart.
Marc Chaikin has made some solid calls over the years, but the results inside The Power Gauge Report are more mixed than the marketing might suggest.
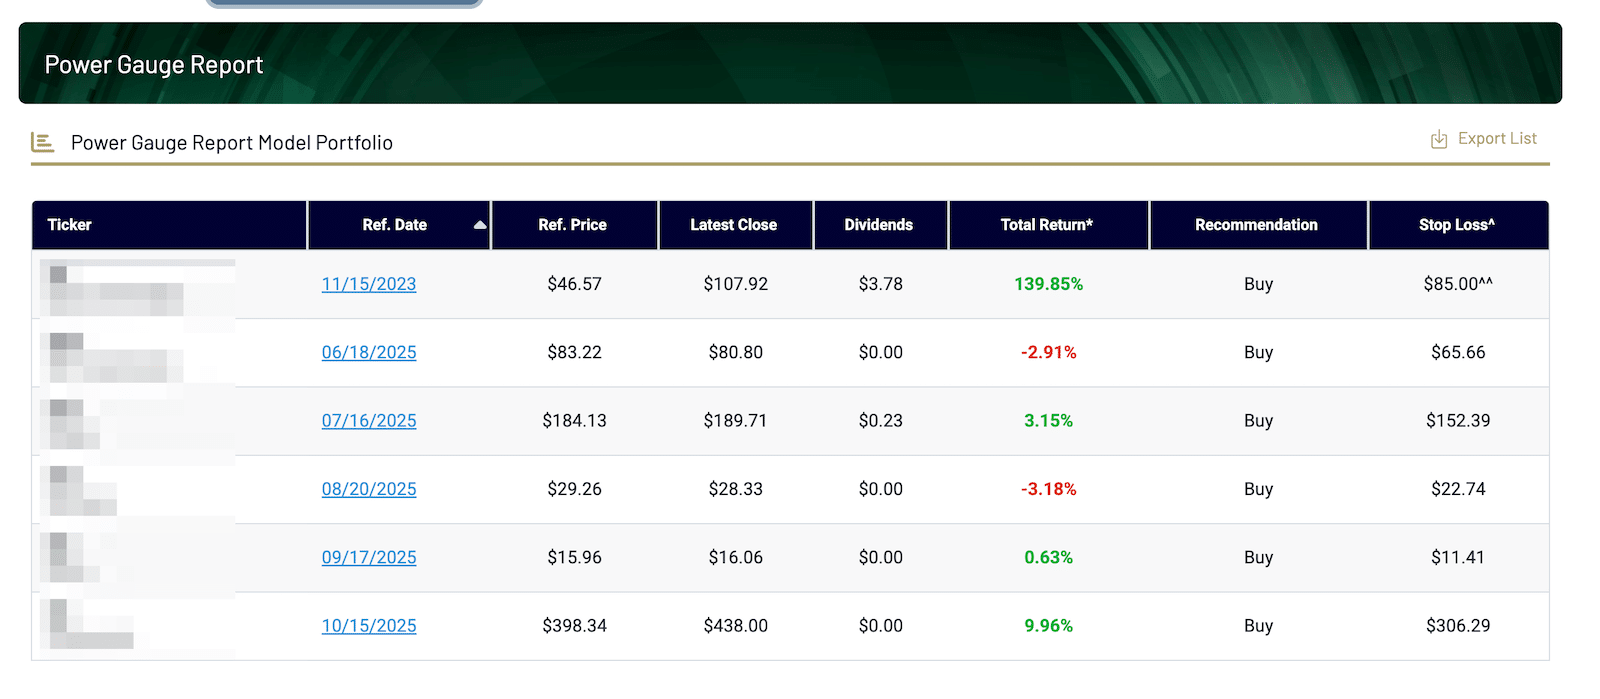
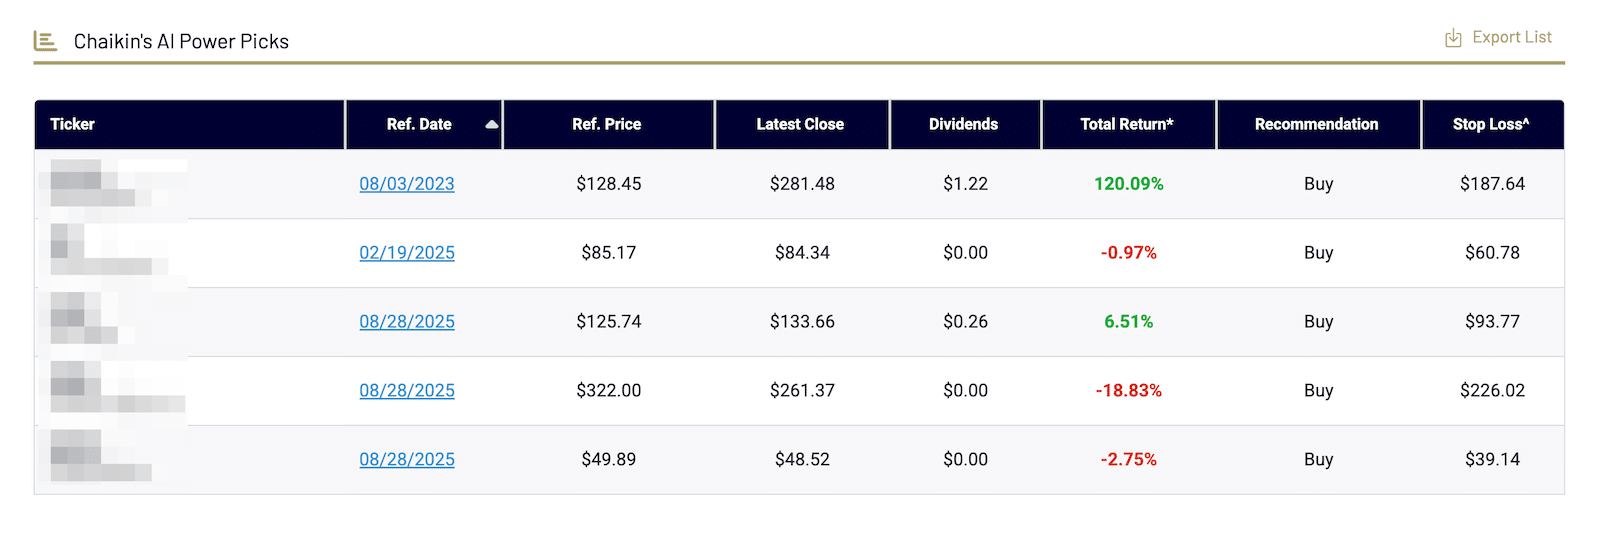
The Power Gauge Report currently maintains two active model portfolios for subscribers, each built with Marc Chaikin’s 20-factor stock-rating system.
One focuses on the core Power Gauge Report picks (larger, fundamentally strong names across finance, technology, and industrials):

And the other, referred to as “Chaikin’s AI Power Picks,” highlights stocks tied to innovation themes such as automation, digital infrastructure, and artificial intelligence:

Both portfolios reflect the Power Gauge’s core philosophy — that strong fundamentals, technical momentum, and positive ‘expert’ signals (analyst upgrades, insider activity, short interest) often precede outperformance.
But like any quant-driven model, results are uneven. Some positions have surged, while others have lagged, showing that even a disciplined system won’t capture every swing or sector rotation.
Those screenshots show only the open positions, though.
What about the closed positions?
There’s no consolidated ‘closed trades’ page. To see performance over time, I reviewed the 2025 monthly updates, where Chaikin lists buy and sell alerts.
According to Chaikin’s subscriber-only archives, the 2025 closed trades showed the following percentage outcomes (tickers withheld out of respect for the paywalled service):
- + 22% gain (Sep 3, 2025)
- + 79% gain (Aug 29, 2025)
- – 28% loss (Aug 12, 2025)
- + 25% gain (Aug 8, 2025)
- – 8% loss (Jul 22, 2025)
- – 14% loss (Apr 9, 2025)
- – 31% loss (Apr 9, 2025)
- – 25% loss (Apr 7, 2025)
- – 15% loss (Apr 4, 2025)
- + 15% gain (Mar 7, 2025)
- – 3% loss (Mar 7, 2025)
- – 6% loss (Feb 28, 2025)
- – 11% loss (Jan 31, 2025)
When averaged together, the 2025 closed trades worked out to roughly break-even performance overall, with four winners and nine losers; a few larger gains offset much of the downside.
It shows that while the Power Gauge is a solid tool, it doesn’t always get it right.
It reacts to data — it doesn’t anticipate greatness.
That’s the real limitation of any algorithmic model.
Algorithms can measure strength, but they can’t spot the next Amazon before the numbers do. That takes something no formula can replicate: real human insight.
SPECIAL EVENT:
In a Special Event with Bill O’Reilly, Legendary Stock Picker Alex Green Predicts That the “Rebirth of the American Dream” Could Send 3 Little-Known Stocks Soaring and Create 20 Million New Millionaires:
See the 3 AI Stocks Now ►Who Is the Power Gauge Report Best Suited For?
The Power Gauge Report is ideal for investors who like structure — those who prefer a clear, data-driven framework to guide decisions.
It gives you objective readings based on fundamentals, technicals, and sentiment, and it’s excellent for anyone who wants discipline and consistency in their investing process.
That said, it’s designed for pattern recognition, not foresight.
The Power Gauge excels at analyzing what’s already visible in the data — not necessarily spotting the next great company before the metrics confirm it.
If you want a systematic way to stay aligned with trends, it’s a strong fit.
But if you want research that pairs hard data with real-world experience — the kind of human perspective that sees value before the algorithms do — there are better options.
After all, most rating systems once labeled Amazon, Netflix, and Nvidia as “junk.” Yet they became some of the strongest, best-performing stocks of our lifetime.
And in the end, all it takes is one great stock to change your financial future.
Pros
- Well-built platform: Clean, professional interface with genuinely useful tools.
- Clear, rules-based system: Great for investors who like structured, data-backed decisions.
- Objective insights: Combines fundamentals, technicals, and sentiment into one simple score.
- Educational value: Helps investors understand how different factors influence stock performance.
- Promotes discipline: Encourages consistent, emotion-free decision-making.
Cons
- Reactive, not predictive: It spots existing momentum — it doesn’t anticipate early breakouts.
- Mixed performance in 2025: Despite some decent wins, the service has only achieved a roughly break-even performance in 2025.
- No historical transparency: Closed trades aren’t easily accessible; you need to dig through archived updates manually and piece it all together.
- Limited originality: Often highlights larger, already well-known stocks instead of emerging opportunities.
- High price point: $499 per year feels steep for what’s essentially a data-model-driven newsletter, and there is only a 30-day refund policy in place.
Is There a Better Alternative?
The Power Gauge Report is a solid, structured system — great for anyone who prefers rules, data, and consistency.
But if you’re interested in how seasoned investors are finding the next generation of great American companies — before the numbers fully reflect their potential — this presentation is worth your time.
It features longtime Oxford Club strategist Alexander Green sitting down with Bill O’Reilly to discuss the resurgence of the American Dream — and the three AI stocks he believes could lead the way in 2025.
It’s not a sales pitch — it’s a rare look at how one of America’s most respected investors applies decades of experience to uncover opportunities the algorithms tend to miss.
You can watch the full presentation here:
Go Here to Watch the Presentation ►
